Introduction
This article presents a high-level study that uses Mermaid to look at the impact of metocean conditions on installing an array of floating wind turbines at three different sites in European waters. The aim is to demonstrate both how useful and powerful Mermaid is and to inform the reader of how sensitive to wave height the tow and installation phase can be and how this varies significantly both seasonally and geographically.
We have used Mermaid to simulate the tow out and connection to three anchors of ten turbines at a site offshore of Wales, western France and in the Mediterranean. Mermaid has been used to assess how long the entire campaign will likely take dependent on start month.
Within the study we have varied the wave height limit on the hook-up tasks to assess how sensitive this phase of the operation is to this parameter throughout the year and across the different sites.
The results of this study should not be used in any planning activities, it is for illustrative purposes only. For a truly representative study, more detailed assessment of task durations and thresholds should be carried out.
Model Set-up
Tow and Installation tasks
Built into the Mermaid model is a straightforward set of tasks that represent the three stages of port activities, tow to site and then connecting to the pre-installed anchors.
The port activities represent tasks such as attaching the towing vessel to a platform, vessel manoeuvring and warranty survey certification. The tow to site has a speed of 3 knots and has a wave height limit of 1.5m. Once on site there is allowance for arrival activities such as locating the correct site, transferring technicians and ballasting the floating structure.
This is then followed by a set tasks for the mooring line hook-up, such as locating, attaching and tensioning, followed by an ROV inspection. The model has been set up so that the vessel must install at least one mooring line after transit and is then allowed to weather-off if required. We have tested the sensitivity of this phase by modelling it with three different wave height limits.
This set of port activities, tow and hook-up tasks are then repeated ten times to replicate the installation of a small floating wind farm development.
A schematic of the flow diagram is presented in Figure 1 below, with further details of task durations and weather limits presented in Table 1. The full flow diagram, as seen in Mermaid is shown in Figure 2.
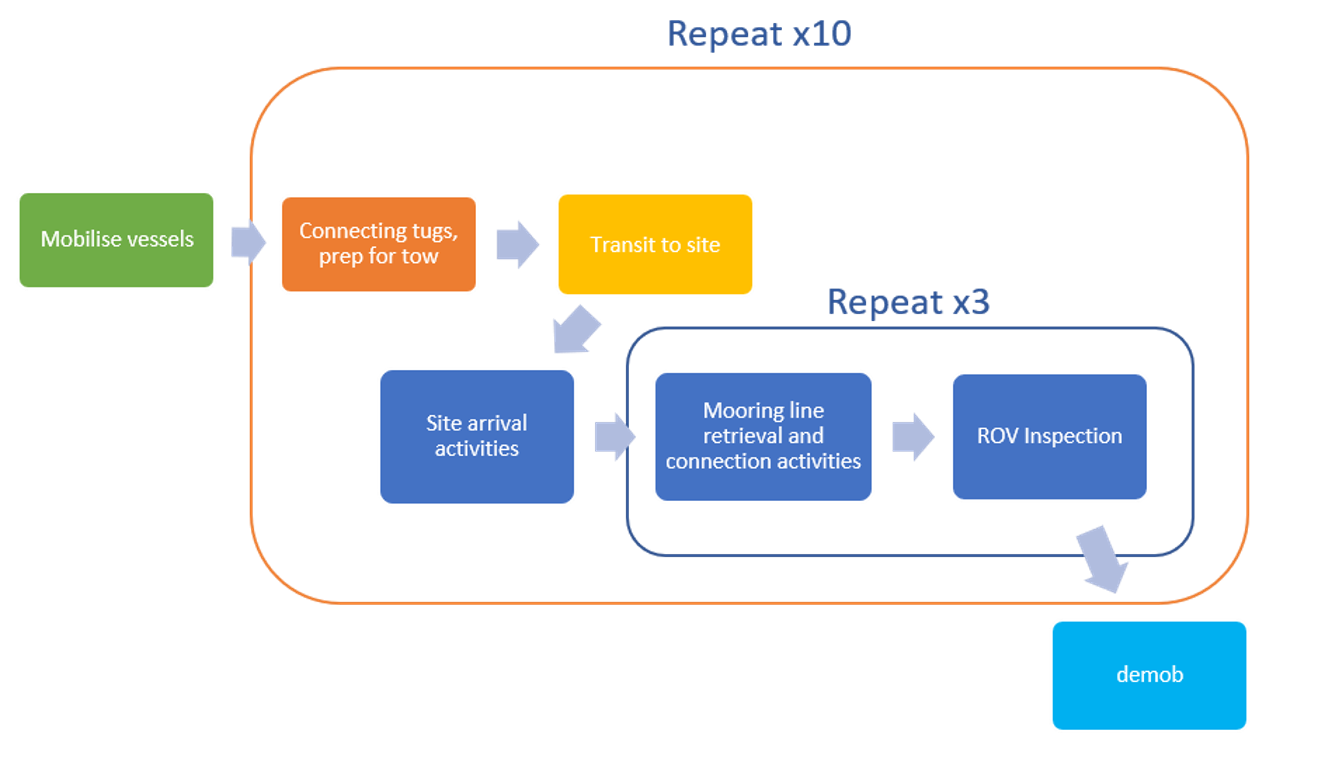
Figure 1. Schematic flow diagram of installation tasks
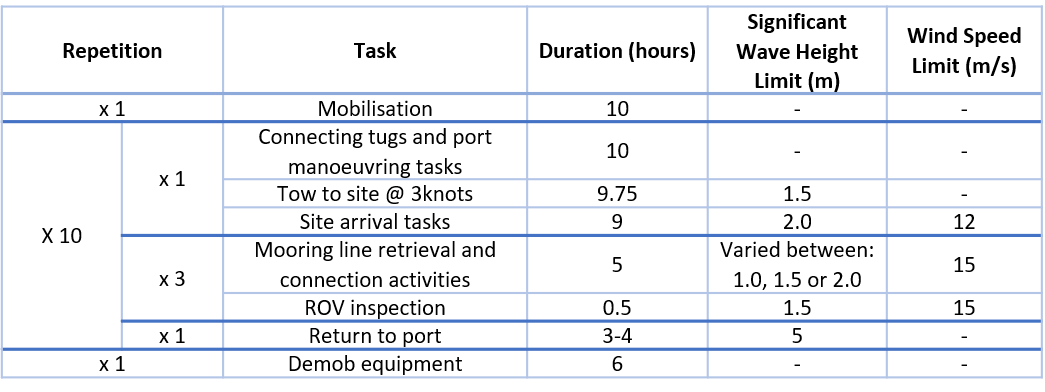
Table 1. Tow and and installation task duration, weather limits and repetition details.

Figure 3. Flow diagram as it appears in Mermaid.
Study Locations
The installation operations have been modelled for three different locations; the Celtic Sea offshore of southwest Wales, St.Nazaire region of western France and the Gulf of Lion in the Mediterranean. Maps of each location, showing wind farm, mobilisation port and transit routes are provided in the figures below.
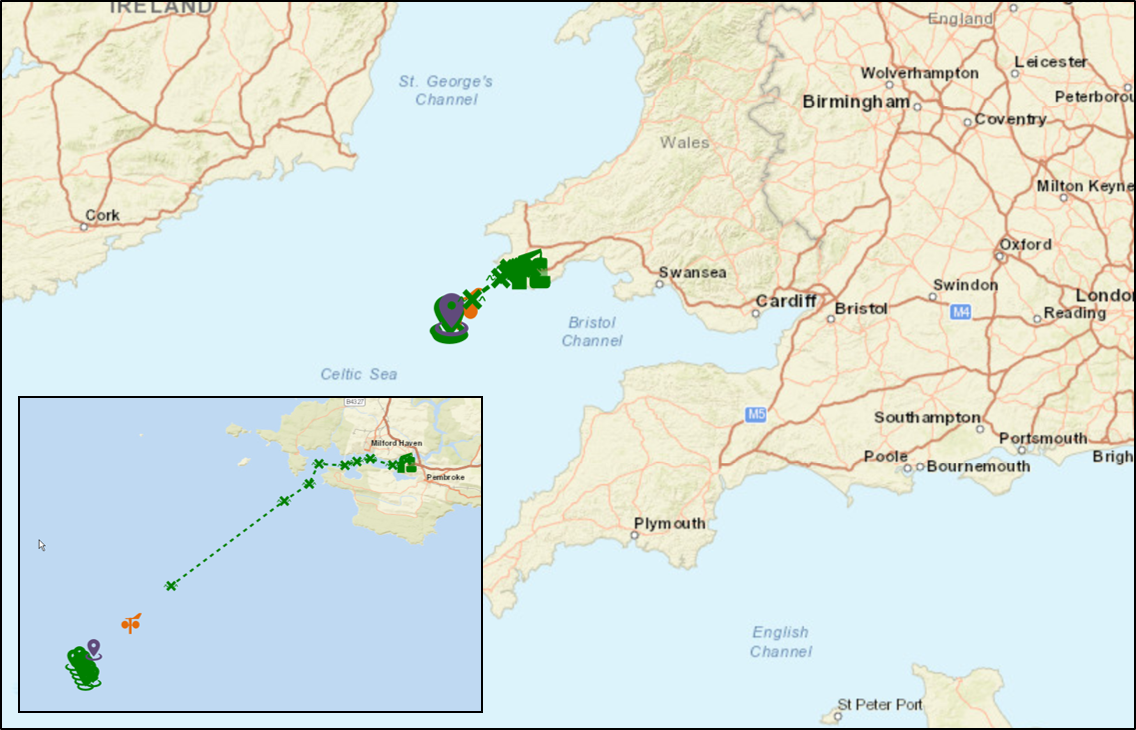
Figure 3. Location map of Celtic Sea FLOW site.
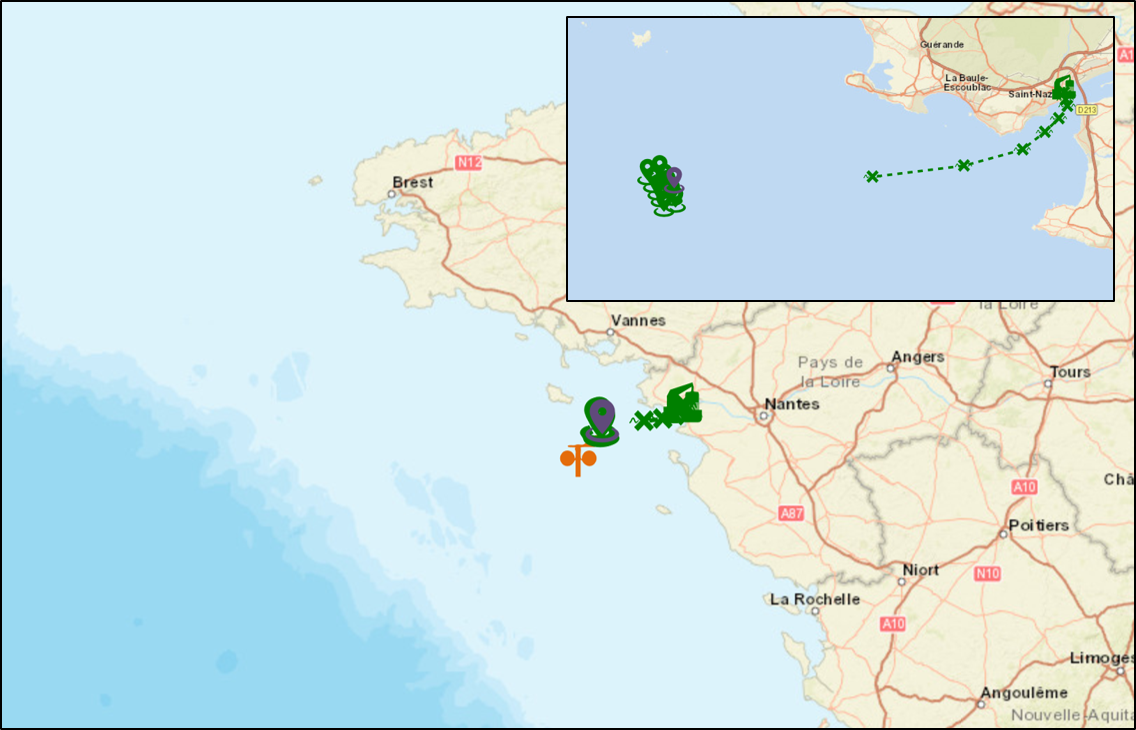
Figure 4. Location map of St.Nazaire FLOW site.
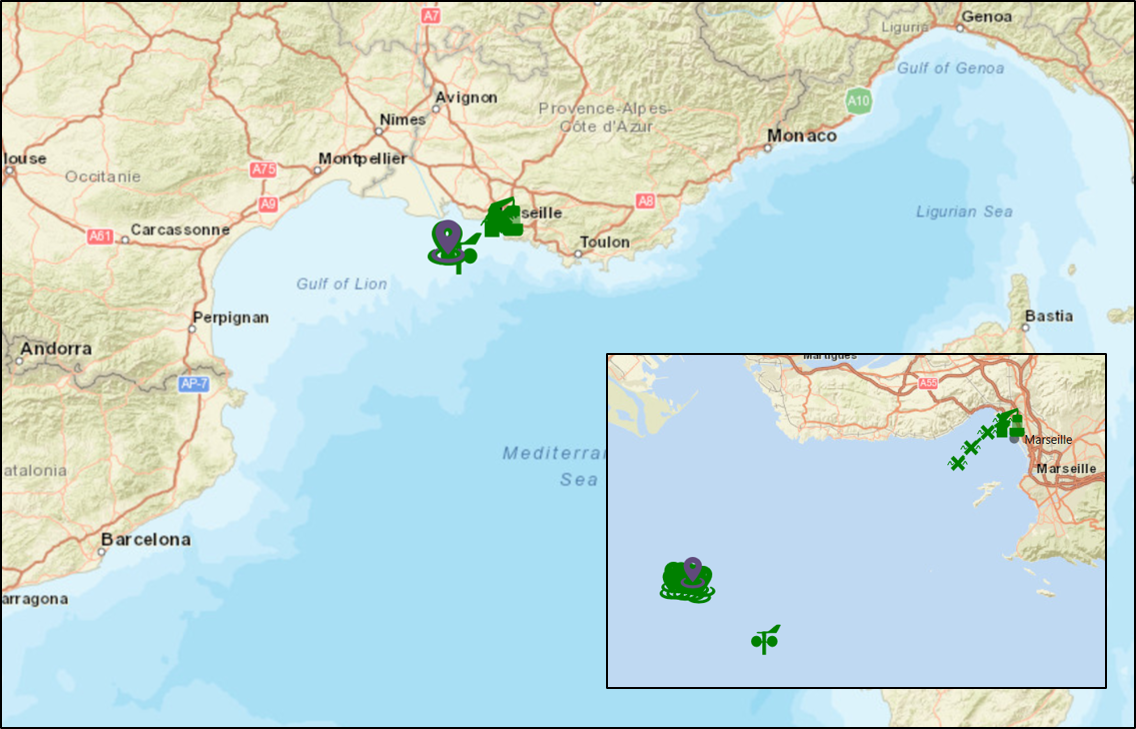
Figure 5. Location Map of Gulf of Lion FLOW site.
Results
The model of the operation has been run multiple times, starting twice a month, through a 10-year wind and wave hindcast dataset. The software calculates how long the operation would have taken on each instance, considering the weather and the various task and vessel restrictions. For each location the model has been run three times, each with a different wave height limit on the hook-up tasks (1.0m, 1.5m and 2.0m).
Mermaid presents a wide range of outputs to help assess operation durations, percentile statistics, schedules and potential bottlenecks. In this instance we shall focus on the total operation duration.
Total Duration Statistics
The following Box and Whisker plots show the total installation time statistics for the three sites with the three different wave height limits for the turbine hook-up tasks. The Box and Whisker plot shows the minimum, P25, P50, P75 and maximum durations, as calculated from the Mermaid simulations.
Figure 9 presents an overview of all of the P50 (median) durations.
There are many detailed comparisons that could be made from these results – we could look at average durations, extreme durations, seasonal variability, location differences and differences caused by the hook-up wave height limit. For the sake of brevity, we shall discuss some overall trends in the P50 durations, the difference across the locations and the differences caused by the change in hook-up wave height limit.
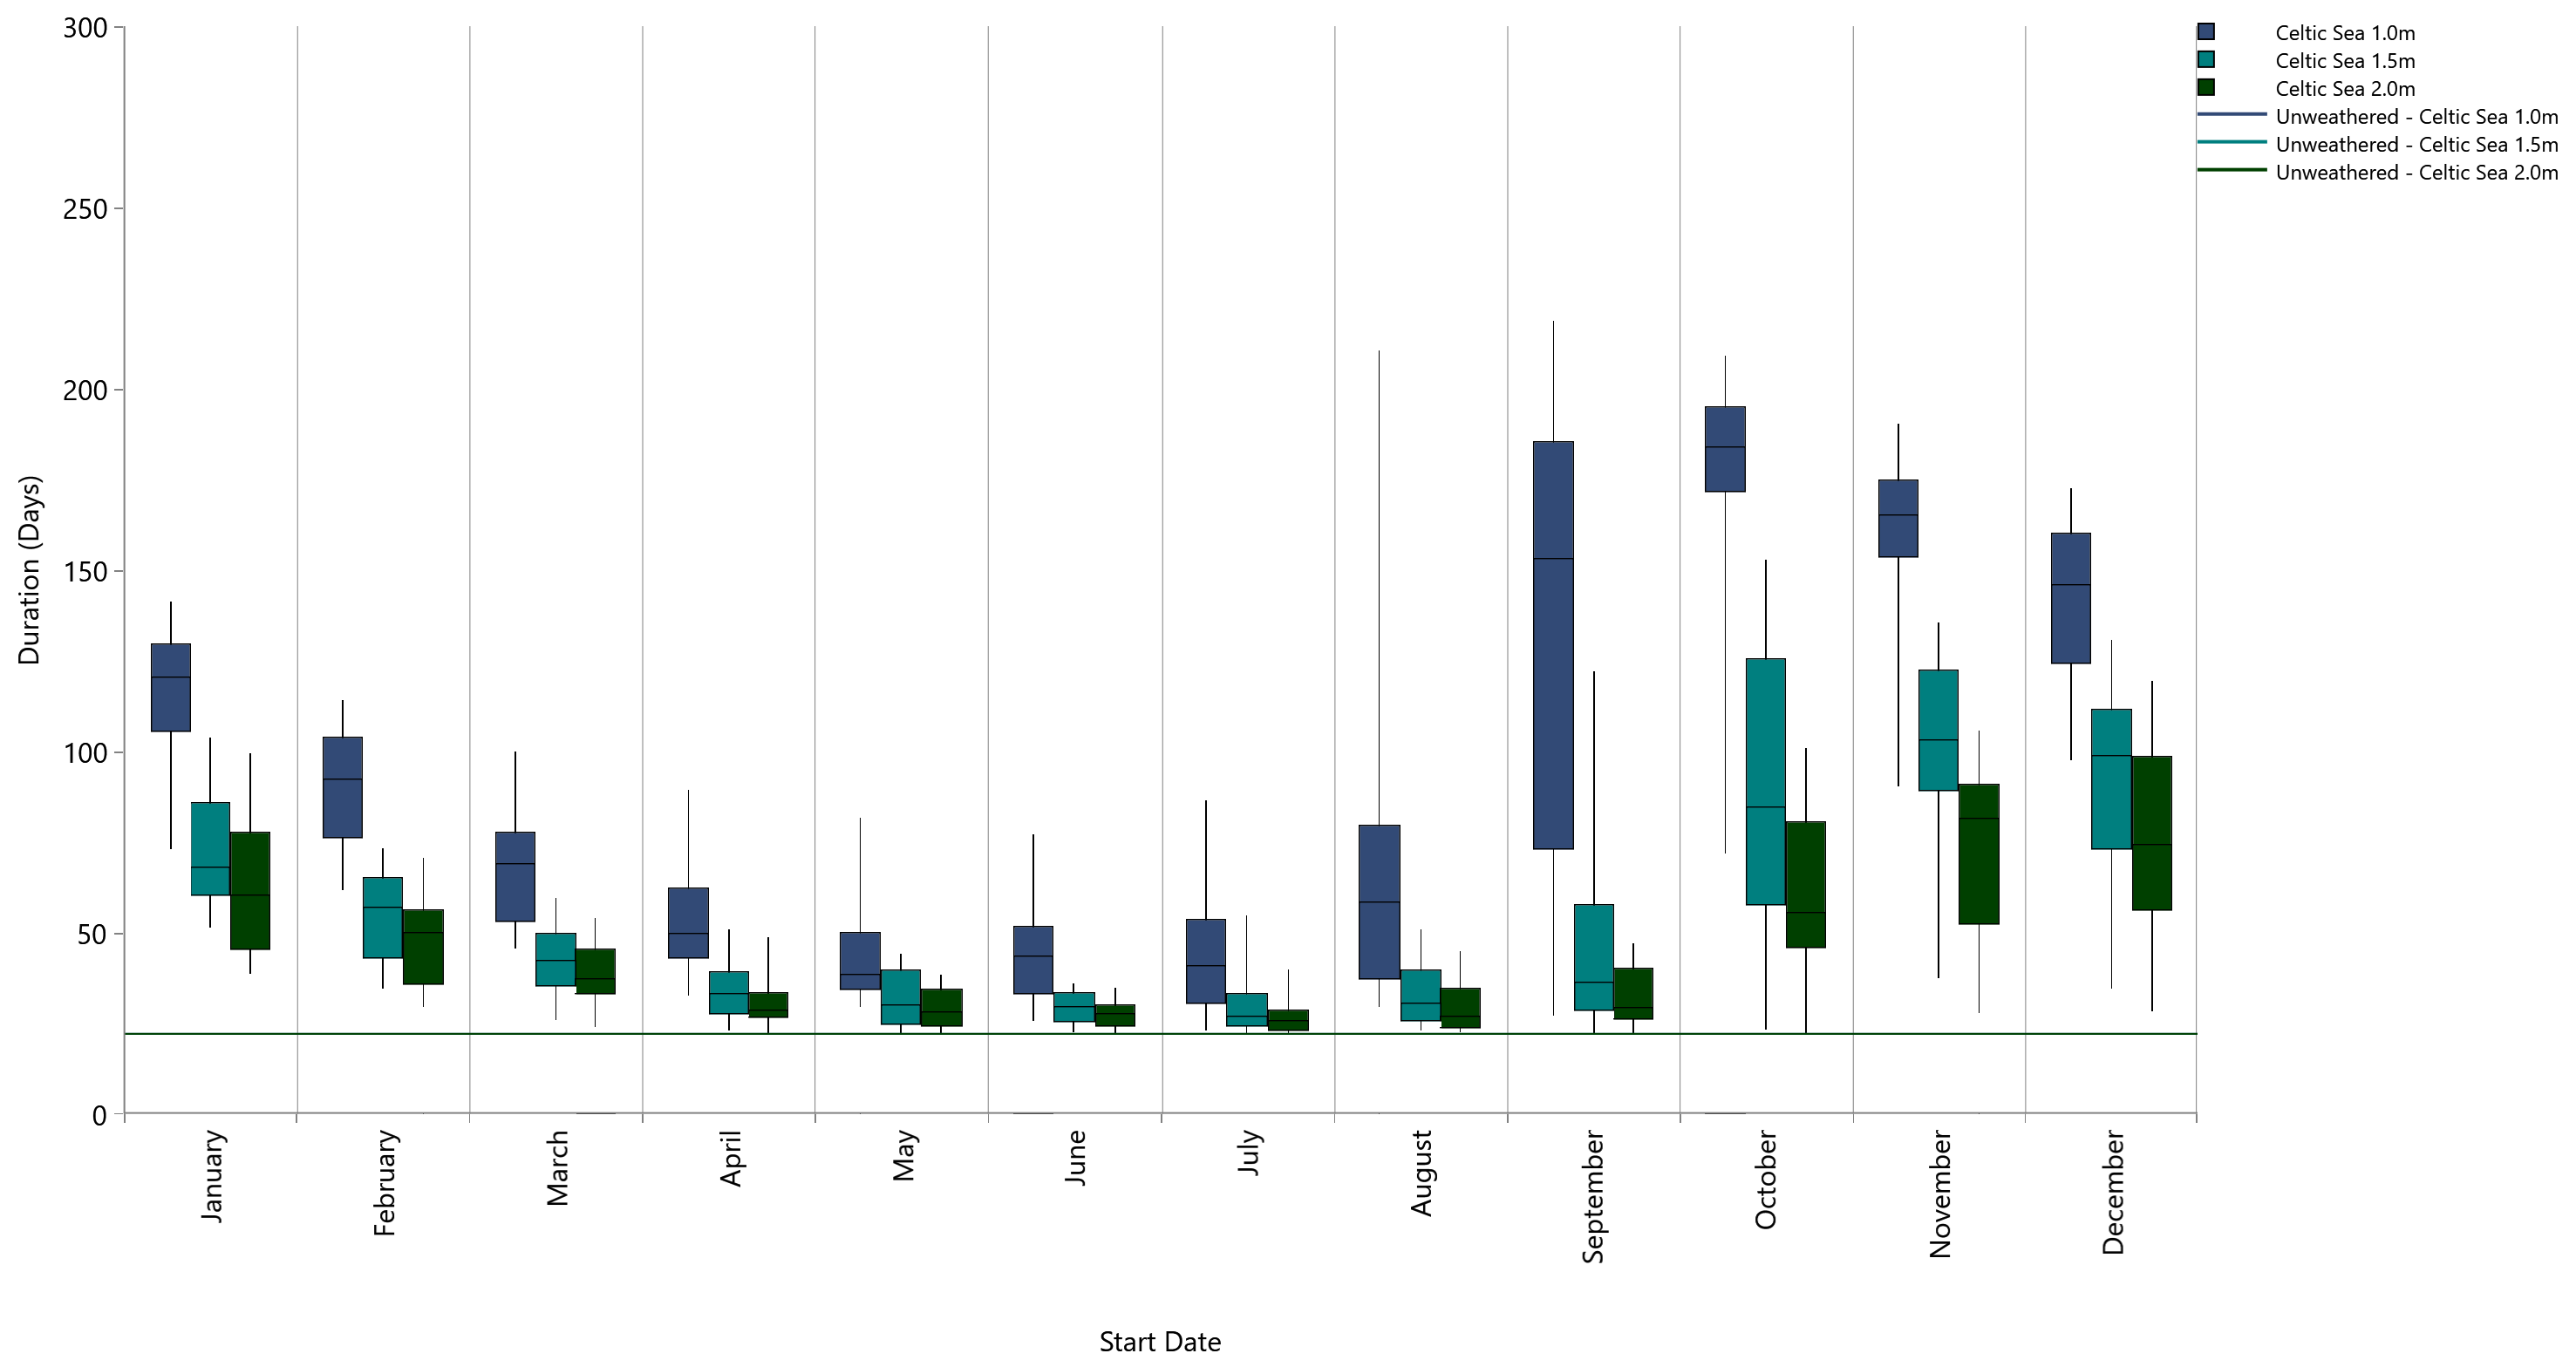
Figure 6. Box and Whisker plot show total duration statistics of FLOW installations at Celtic Sea site.
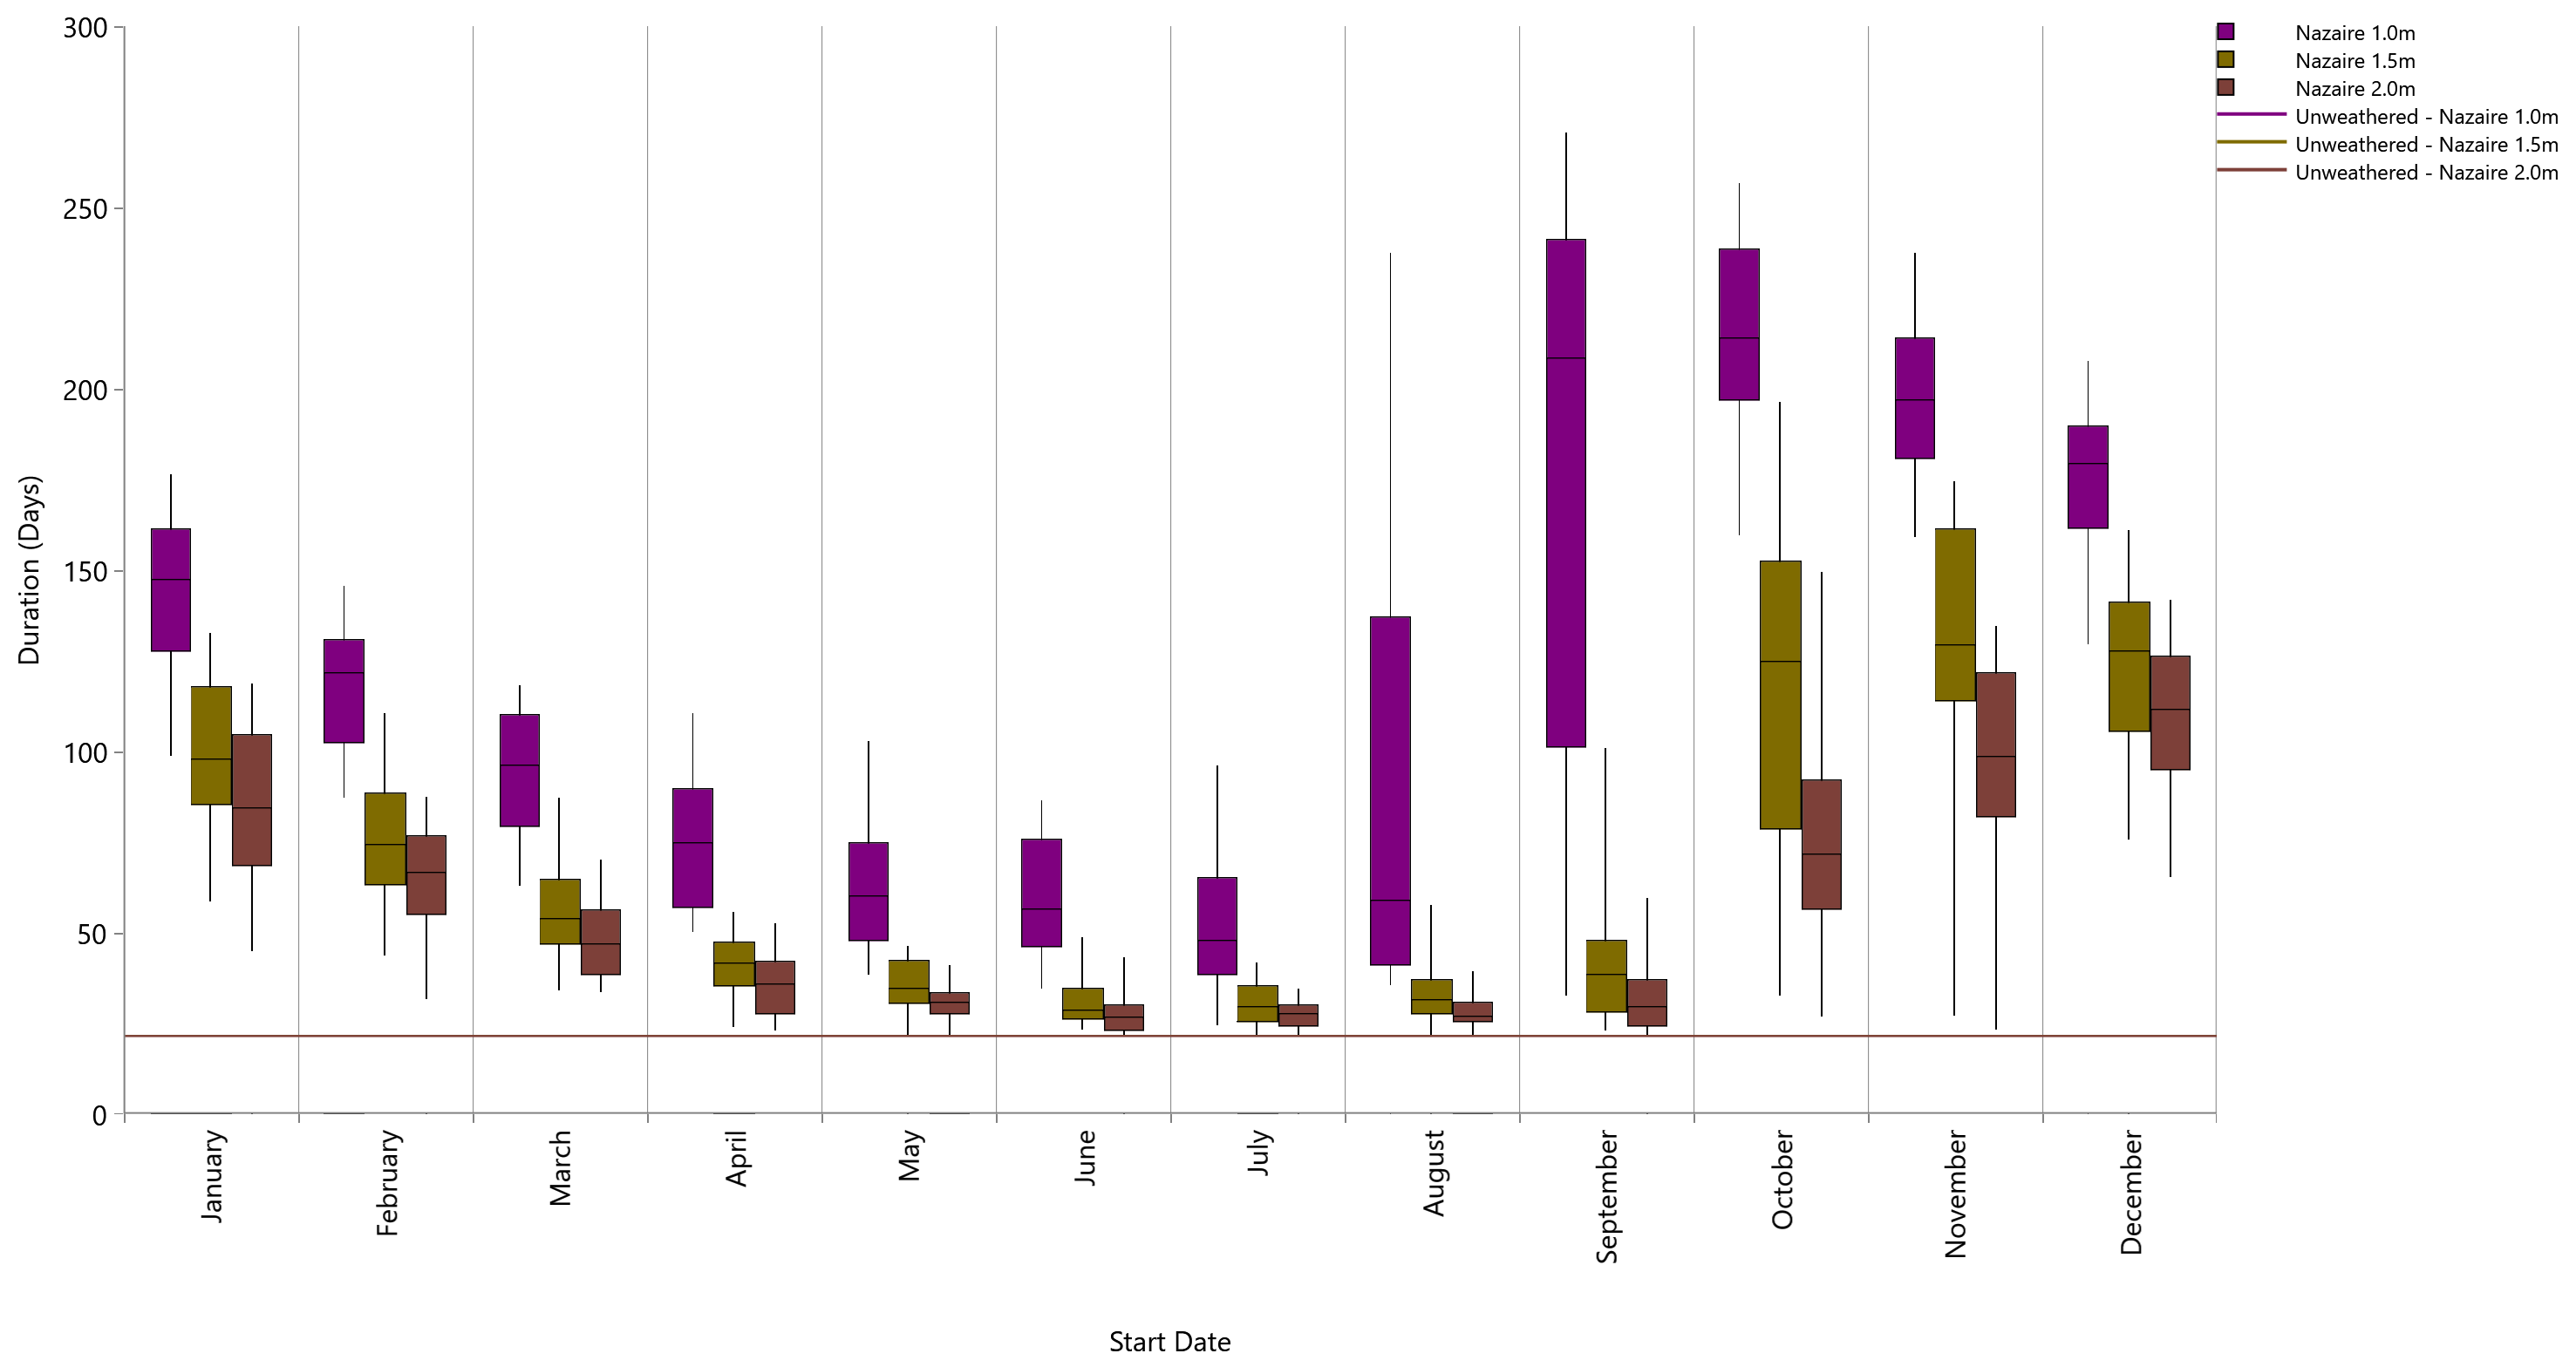
Figure 7. Box and Whisker plot show total duration statistics of FLOW installations at St.Nazaire site.

Figure 8. Box and Whisker plot show total duration statistics of FLOW installations at Gulf of Lion site.
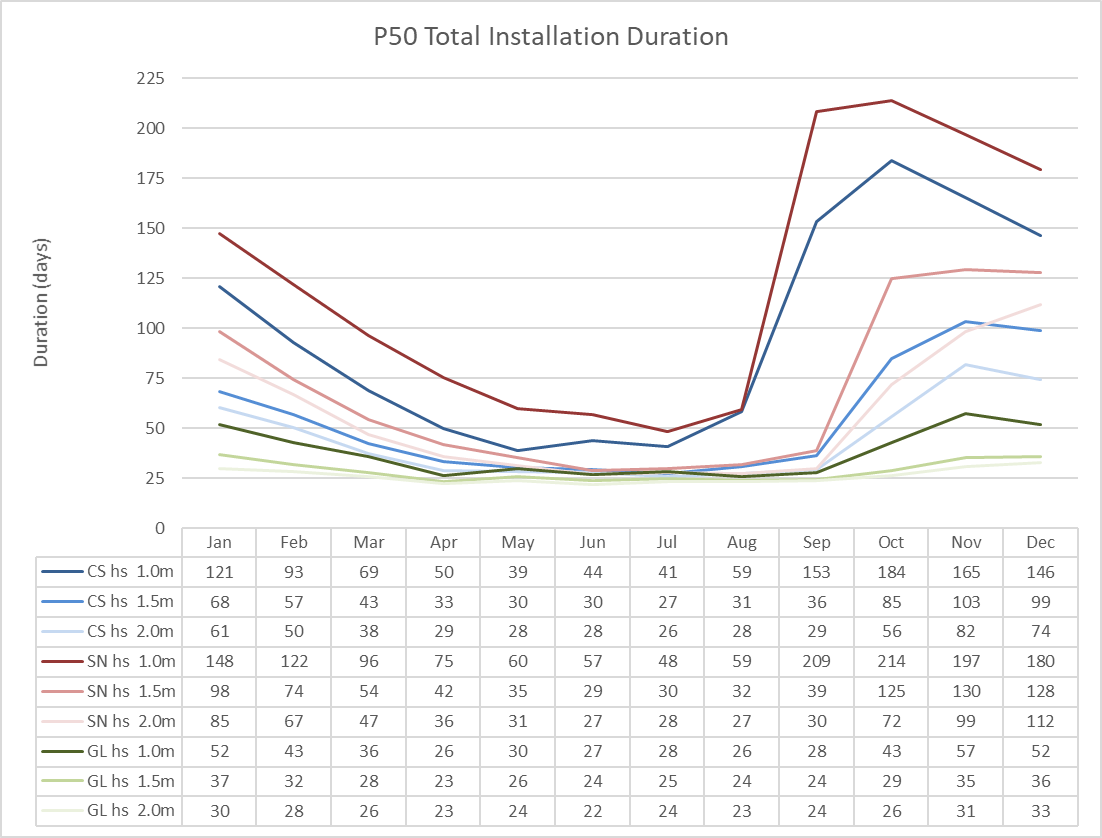
Figure 9. P50 durations from all simulations.
Location Trends
As expected, the range in duration times vary across the three regions. The St.Nazaire region experiences the longest duration times, with the P50 ranging from 27 days in August with a 2.0m wave limit to 209 days when starting in September with a 1.0m wave limit.
Installing in the Celtic Sea offshore of Wales has slightly lower duration times, with the P50 duration ranging from 26 days in July with a 2.0m wave limit to 184 days when starting in October with a 1.0m limit.
The difference in P50 duration times between the Celtic Sea and St.Nazaire regions is most pronounced when starting between October and March and when the hook-up wave height limit is 1.0m, where the biggest difference is 55 days (September). When starting in the late spring and summer, installation times are very similar at the two sites.
As expected, the installation times are much quicker with far less variability at the Mediterranean site, with the P50 only ranging between 23 and 57 days depending on start month and wave height threshold. At its most extreme, the maximum simulated duration time was 92 days, when starting in December, with a 1.0m wave height limit. Between March and September, the P75 duration is below 40 days regardless of the wave threshold.
Seasonal Trends
Whilst the weather may not be the worst in September or October, it is clearly a bad time to start an installation campaign as you will run into the full late autumn and winter season. August, September and October also exhibit the largest range in operation durations, the worst case being 30-270 days. This reflects the fact that at this time of year, in the northwest continental shelf region, the weather can typically be dominated by a high-pressure system and so is calm and benign or be under the influence of an active jet stream with storms persistently tracking in from the Atlantic.
What may not initially be too obvious is that starting the campaign early in March or April may only cause a small extra time penalty but may be worth it in case of other delays, such as technical downtime, vessel or supply issues. The increase in durations from when starting July to September and October is significant: unforeseen delays that push you into this season may be costly.
Wave Height Threshold Trend
The difference in durations as a function of the hook-up wave limit are pronounced, especially for the Celtic Sea and St.Nazaire sites. As expected, the lower the wave height limit the longer the duration and downtime. However, there is a marked increase in downtime when the limit reduces from 1.5m to 1.0m. For example, in August in the Celtic sea the P50 duration increases from 31 to 59 days. The most extreme difference at the P50 level is an increase from 39 days to 209 days, occurring at St.Nazaire for operations starting in September.
The differences between the durations for a 1.5m limit and 2.0m limit show much smaller differences at these two sites, especially between February and August where there are differences of between 1 and 7 days in the P50 durations. More noticeable differences occur in the winter, where the P50 durations are typically 20 to 40 days longer with 1.5m threshold compared to 2.0m.
As previously mentioned, the variability is significantly lower in the Gulf of Lion. When considering the installation wave height limit, we can see that at 1.5m and 2.0m the total durations are very similar, with less than 8 days difference occurring in the P50’s. There is more of an increase in downtime when the wave height limit is 1.0m, with up to 22 days more downtime than with a 1.5m limit.
Conclusions
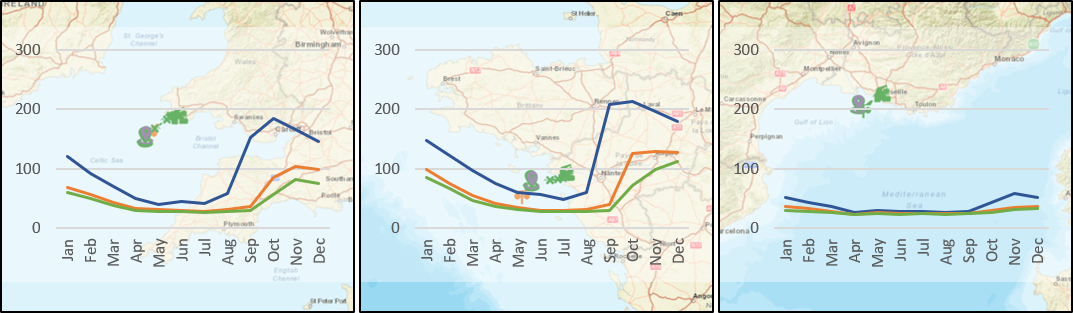
Figure 10. Summary of P50 durations across the locations.
The analysis undertaken here has been broad and covers a range of the standout results. We have shown how, across the three locations, that the St.Nazaire region would like suffer the most downtime during installation. The Celtic Sea site typically suffers between 15% to 30% less downtime, depending on start month and wave height threshold. The Mediterranean, as expected is far more benign and is likely to experience little downtime.
We have shown some useful seasonal intelligence on how installation times could increase significantly if the campaign start date is left to late summer or early autumn. Conversely, the increase in installation time if starting early in the season is less severe.
One of the potentially critical outcomes is that Mermaid has highlighted how the choice of significant wave height limit on mooring line connection activities can have dramatic impacts on the installation time. If the wrong vessel is chosen at the wrong time of year, then large delays are very likely.
This article has been written to illustrate how Mermaid can easily be used for installation studies and for rapidly comparing and contrasting various options. A more in-depth study would certainly reveal further intelligence and many other diagnostics are available through Mermaid, such as identification of critical tasks, how long each turbine installation takes and calculating the number turbines installed per month.
Mermaid is a crucial tool in the efficient design and project management of any installation project and can help save significant costs and time.
Get in touch to inquire about a demonstration of the software or to discuss a project that would benefit from this kind of analysis.