The past month has seen two significant software updates to Mermaid. This article introduces these updates and explains what benefits they bring the user. If you’re not a current user and would like to know more, then try a free trial – Get in touch!
Metocean Climatology Statistics Module
This significant upgrade of Mermaid sees the introduction of the Metocean Climatology Module and makes Mermaid one of the most diverse and comprehensive weather planning tools available.
It provides the options to generate both simple climatology statistics and complex simulations of marine operations together with a free metocean database.
The climatology module will allow the user to very quickly generate a range of basic metocean statistics. These will be derived from either the free 10-year database that comes with the software, or from the user’s own imported data.
It allows you to instantaneously get a clear picture of what the likely conditions will be in any month of the year via different exceedance, occurrence and weather windows products.
This is far simpler than a full Mermaid operation analysis; it takes no account of factors such as vessel specifications, transits, task suspendability and repeated operations. But it does enable you to get an idea of the weather risk when there is not time or enough operation details to set up a more complex project.
Statistics are generated through a simple interface where the user can select which data point to use, and which analyses to run. A chart options menu allows you to further tailor the analysis, such as using a single or two parameters, time scale and weather window thresholds and durations.
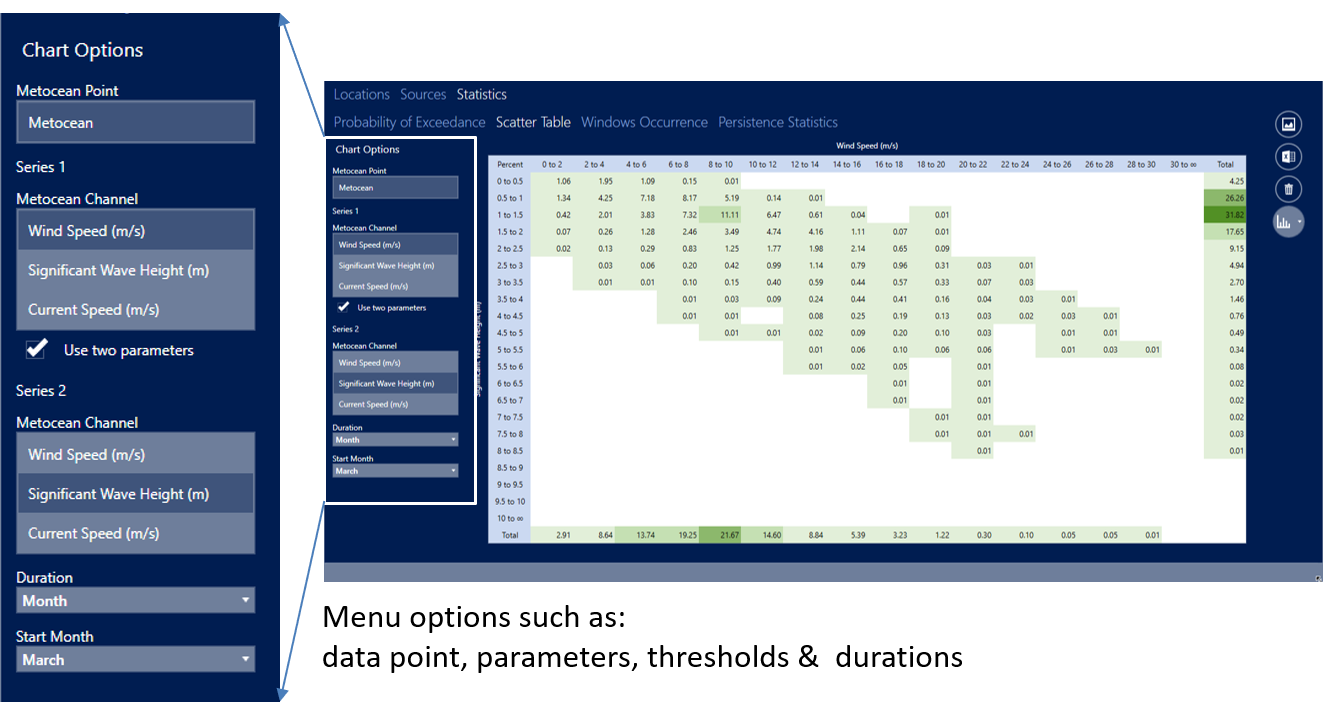
Presented below are examples and descriptions of the products available:
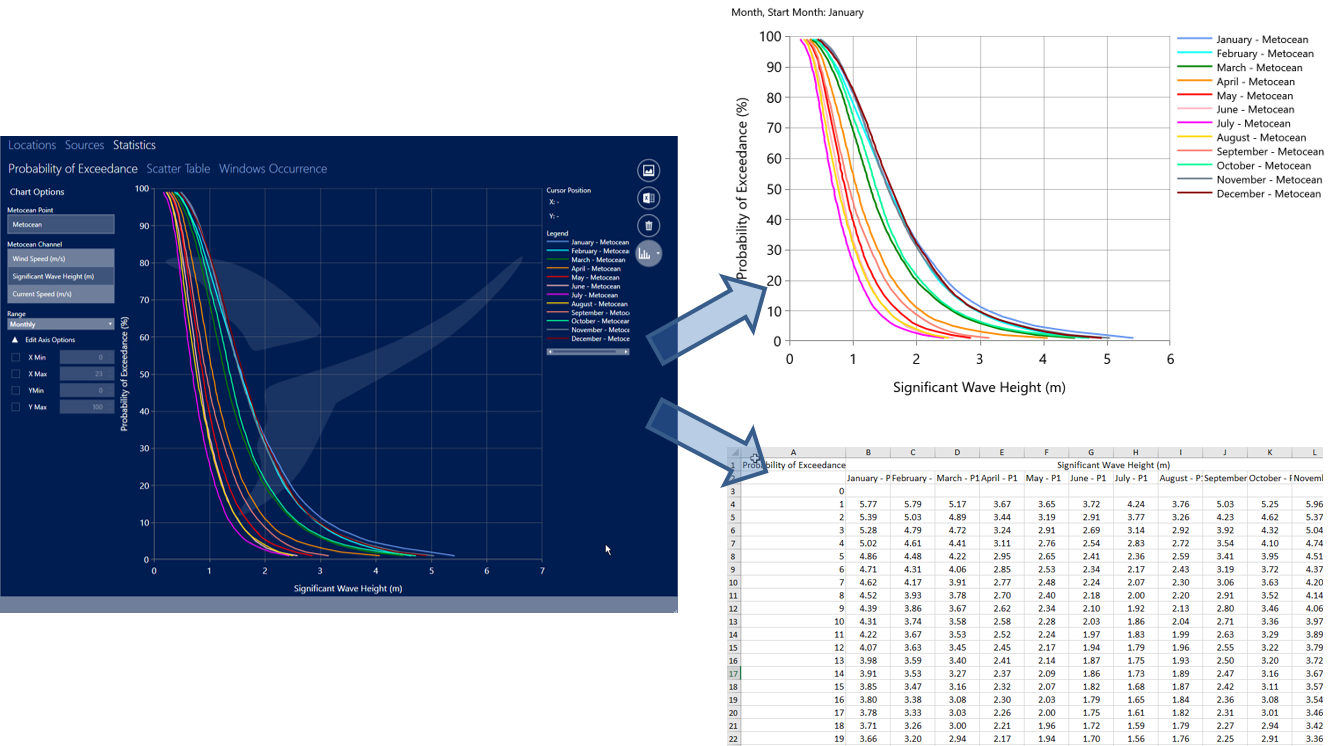
Exceedence Charts
Standard exceedance statistics, showing what proportion of time a parameter is above different thresholds. Straight forward, but extremely useful for understanding the basic climatology of a site. Monthly, seasonal and annual breakdown available. Output to .png image file or raw data to excel for reporting and further analysis.
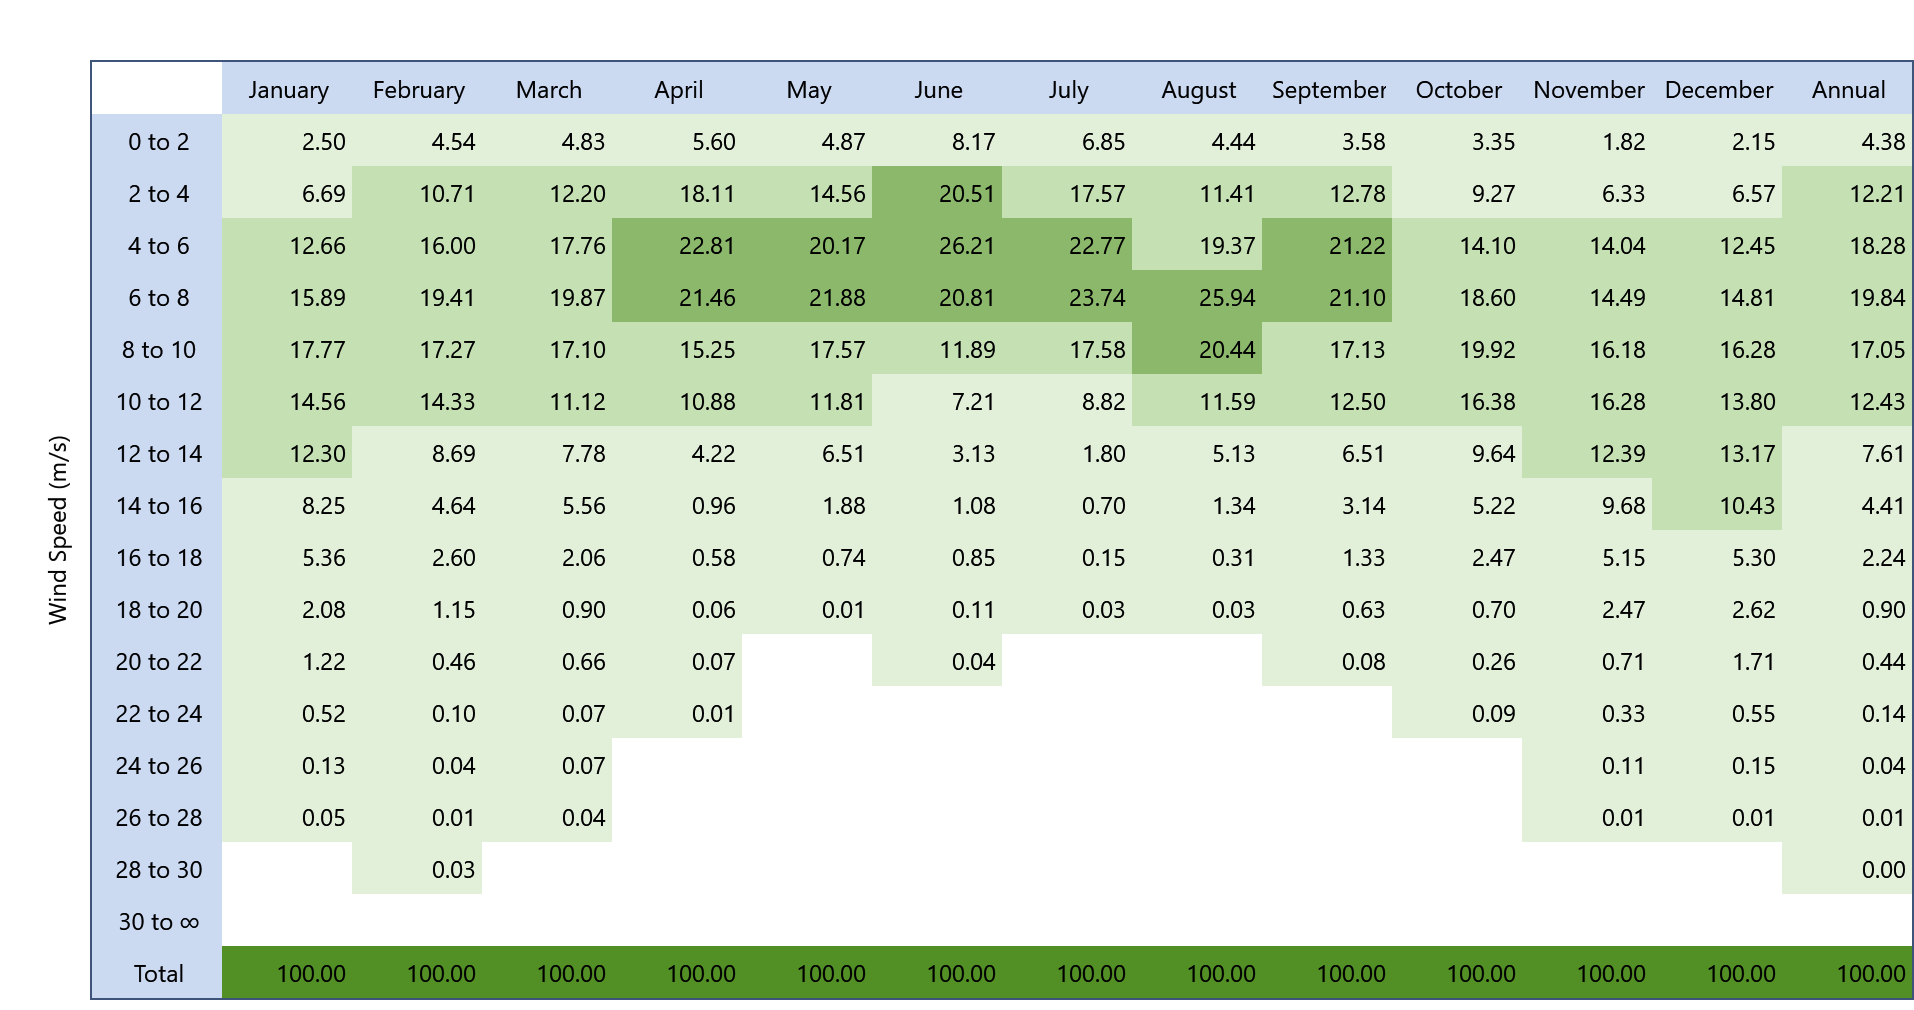
Frequency Distribution Tables
Tables that show the proportion of time that a single parameter or two parameters occur in different value ranges. Monthly and all-year distributions are available, giving you a helpful guide as to likely site conditions throughout the year. Output can be to image file or the raw results to Excel.

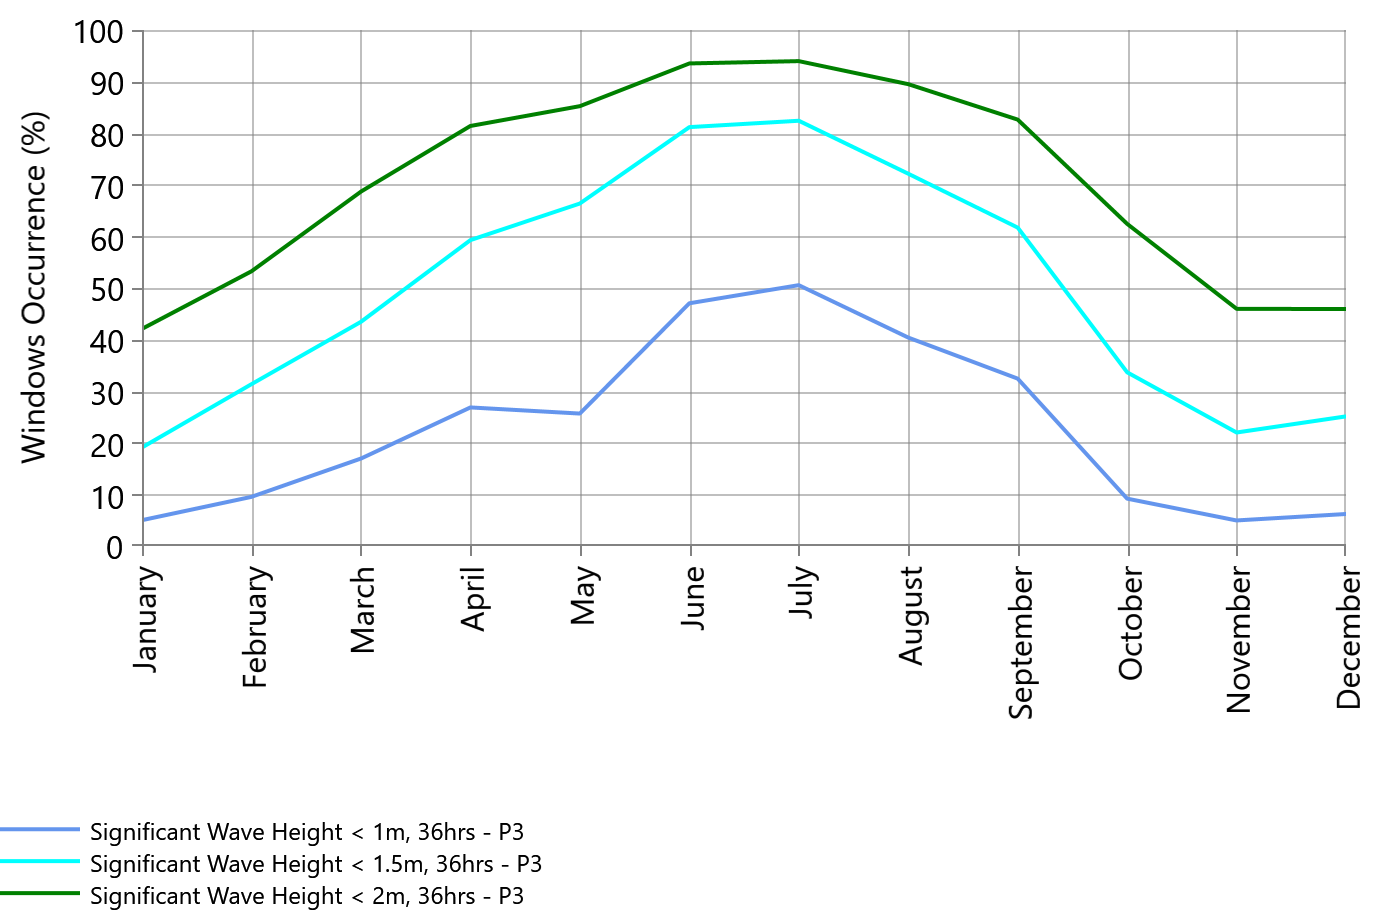
Weather Windows Analysis
This product shows you the likelihood of achieving weather windows of particular durations and thresholds in a given month. The user can specify the durations, thresholds and parameters required. This can be more useful than exceedance and occurrence statistics, as it gives you information on likelihood of actual windows of good weather. Output can be to image file or the raw results to Excel.
For example, the figure below shows that there is 50% chance that you will successfully achieve a 36-hour window of significant wave height less that 1m in July, but only 5% in November.
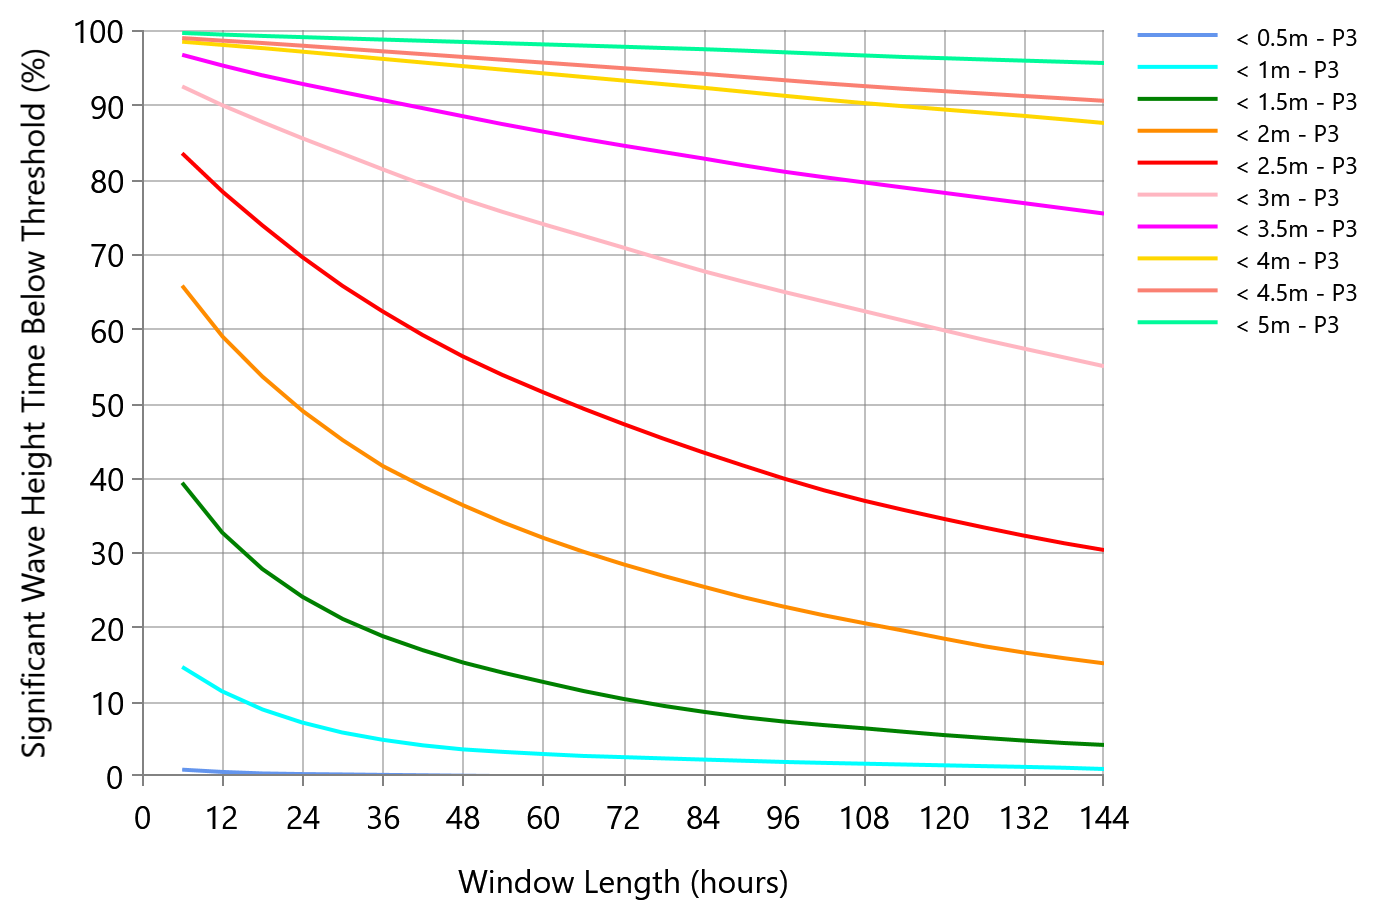
Persistance Statistics
Similar to the weather windows occurrence, this chart shows the statistics on how long a parameter is below a certain threshold. Output can be to image file or the raw results to Excel.
In the example below it shows there is 24% likelihood of wave heights less than 1.5m for up to 24 hours and 9% likelihood of up to 84 hours.
Analysis Results Update
We’ve made a number of updates to the results side of Mermaid, a couple of significant ones and then some minor tweaks to make it more useful:
- Results only version of Mermaid: You can now use Mermaid for free to view results from simulations. This means you can easily share results with colleagues who don’t have a licence and view your library of results if your licence has expired.
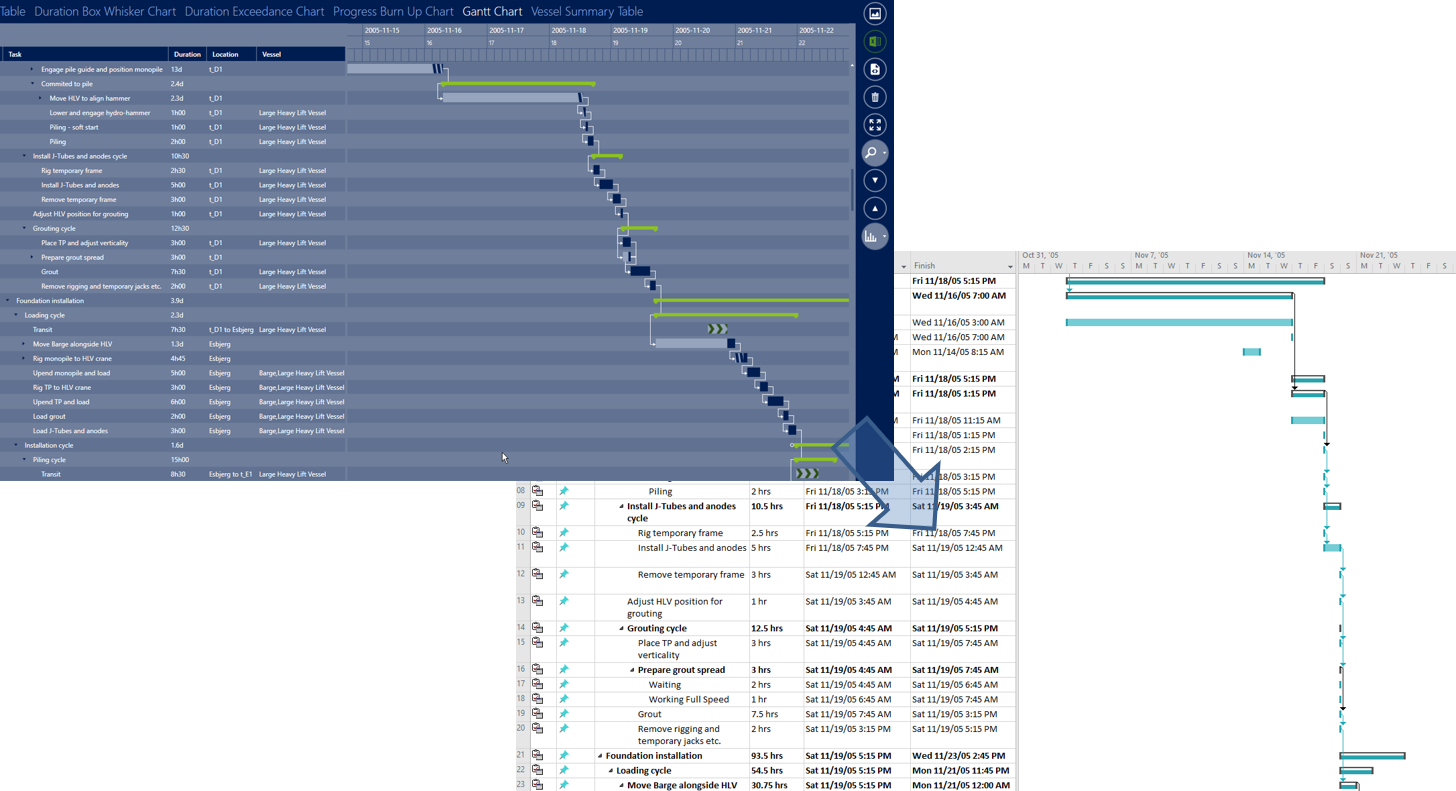
- Output weathered Gantt charts to xml: You can now export Gantt charts of the weathered simulations that Mermaid has run. This is an extremely useful feature if you want to use project files that have a representation of weather impact or tidal windows. This is an upgrade from being able to output just the unweathered schedule.
- Smaller features: Export of progress burn up data to Excel; manual editing of axis limits; cross-hair read-off values on screen; expand & collapse all on Gantt charts; view individual values that contribute to box & whisker plots.